Uptime.com Check Types | Status Code Web Monitoring
How much infrastructure for a domain or application can fail before the customer starts to notice? What causes drive unplanned downtime? The answer to these questions lies in status code web monitoring. Here are just a few examples of services that can be monitored for better piece of mind:
- External payment processors
- API resources
- Email servers
- VoIP protocols for support or chat
- Streaming or gaming servers
- Registration pages
- Best selling products
Web monitoring is most effective when checks run regularly, ping multiple URLs, and improve observability with visibility on the user experience. When you have multiple checks pinging the same infrastructure from different locations, you get better detection rates and faster, more precise alert data.
You should consider the complexity of your website, and of the existing check types for your account to get the best results. We’ll dive into some examples next.
Table of Contents
- General Status Code Monitoring for Domain Infrastructure
- HTTP/S Status Codes and Context
- A Use Case for HTTP(S) Monitoring
- SSL and DNS
- WHOIS Domain Expiry Checks
- Malware/Virus and Domain Blacklist
- Going Beyond Status Code Web Monitoring with Synthetics
- Transaction Checks for Goal Funnel Analysis
- Combine Transaction Checks with RUM
- Speed Testing
- Network Performance Monitoring to Detect Unexpected Outages
- Ping (ICMP)
- Server and Application Monitoring for Complete Protection
General Status Code Monitoring for Domain Infrastructure
HTTP/S Status Codes and Context
Let’s begin with the HTTP(S) check, which can ensure a URL is resolving with status code 200 OK. 200 means the server is up and running, and serving the user’s request. This is one aspect of observability, but it doesn’t tell us whether the user can login or whether the user can make a purchase. It has some optional features that enhance what it can do, and that’s where we improve our visibility with more context.
HTTP/S checks run at one minute intervals, and mimic some of the functionality you might find in a synthetic check. As a result, you can do more than simply check whether a URL is status 200 or not.
For example, you can test for specific pieces of code or expected strings. With this functionality, an HTTP/S check can verify the presence of internal analytics, tracking pixels, or a specific response using the “string to expect” option. Uptime.com can distinguish between a regular expression and an exact match, and can trigger a failure on exact match.
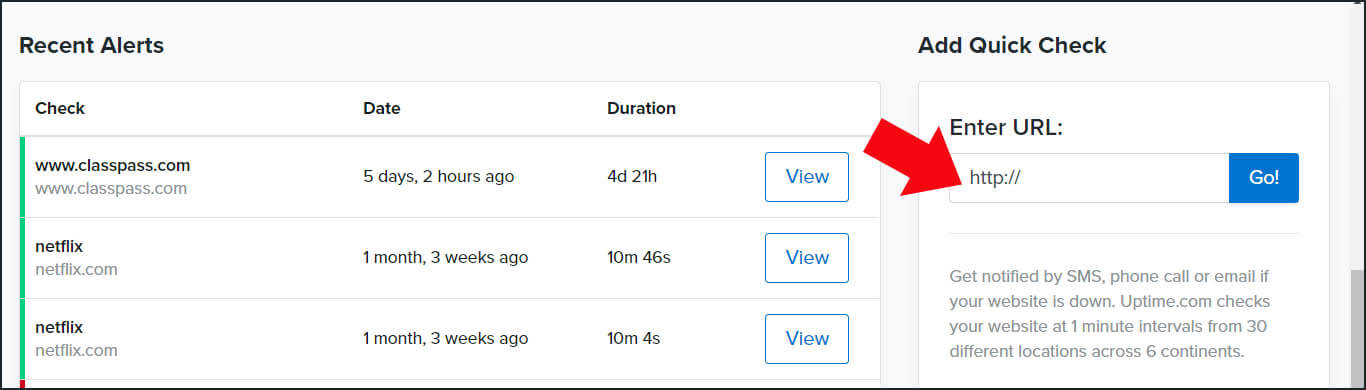
Create an HTTP/S check directly from the Uptime.com dashboard
When you run load balance, HTTP(S) monitoring can tell you more about what has failed for a fuller picture of DNS across multiple servers. The basic HTTP(S) check is fundamental to a robust monitoring system. It provides rapid monitoring of specific endpoints. Although it is limited to a single step, its power lies in devops ability to query and expect specific strings.
A Use Case for HTTP(S) Monitoring
HTTP(S) checks get a lot more interesting when we consider who receives the alerts and what they contain. Let’s think about our homepage, the most important point of entry for most businesses. At 3 AM, our HTTP(S) check goes down and an alert is sent to the admin. Is this the most effective course of action? What if the outage lasts only 5 minutes? What if the outage requires action tier 1 could take?
Escalations helps us to push status code web monitoring to the next level. Tier 1 can receive that initial alert, take tier 1 designated actions and work toward restoring uptime. Automatically, tier 2 can receive the alert as downtime progresses past the 20-minute mark. At that point, management can check in with support, suggest additional action and ultimately observe the downtime. As downtime progresses, with tiers 1 and 2 quarterbacking the incident, the sysadmin is getting some much needed sleep content that the team can handle themselves. If the outage exceeds 2 hours the admin is woken with a timely escalation informing him or her of the current status, length of downtime, and other technical details in the time it takes to read an email.
SSL and DNS
Both SSL and DNS checks run once per day, and their goal is to ensure your DNS records/SSL certifications remain valid and are not in danger of expiration. DNS is the foundation to domain accessibility and a notoriously tricky type of error to diagnose and solve. Checks that monitor DNS also report any changes your DNS provider may make on their end, which helps to alert teams of potential DNS hijacking. This malicious practice is still affecting businesses, siphoning contact details with faked URLs that erode your organization’s trust.
SSL checks ensure the customer gets the safest possible shopping and browsing experience. It monitors your certificate for any changes, and alerts you when any details change (such as the Certificate Authority issuing the certificate, and the identifying information about the company it belongs to).
WHOIS Domain Expiry Checks
A WHOIS check also occurs once per day, and it provides a default advance notice of 20 days if WhoIs information changes or is in danger of expiration. WHOIS data identifies the site’s contact information, and it’s another common vector for attack. Especially for smaller and mid-sized businesses that might not privatize this data.
When this information is changed, it’s a good idea to create an escalation immediately that gets decision makers involved. Such changes may not signal any malicious behavior, but it’s important that stakeholders who can verify these changes act quickly to prevent your customer from suffering an attack.
Malware/Virus and Domain Blacklist
Malware/Virus and Domain Blacklist checks have major benefits to both usability and optimization. Google will recognize when a site passes malicious code, and will blacklist that URL until the problem is fixed. Verifying that the issue is fixed takes time and hurts search accessibility while it’s remedied.
Usability is also affected. Browsers issue dire warnings when a site is suspected of passing on malicious code, which affects trust of the URL and may turn some potential customers away for life.
Clearly, time is a factor if your site ends up on these lists. These once-per-day domain health check routinely-updated databases for the URL you specify. If it appears on any of the lists Uptime.com checks, you receive an alert immediately so you can act quickly.
Want to increase your site security? Get started today with a free trial of Uptime.com, no credit card required.
Going Beyond Status Code Web Monitoring with Synthetics
The user experience is paramount to everything you do. If your site takes too long to load, its major components don’t work, and users can’t navigate it well, you’re going to lose customers fast. Uptime monitoring should provide peace of mind that your userbase is getting the best possible experience as you grow.
Transaction Checks for Goal Funnel Analysis
Transaction checks provide some advanced functionality that simulates the user experience. They utilize a multi-step HTTP/S check to interact with elements on a website. You may have noticed the basic HTTP/S check cannot wait for an expected response, it can only view what’s on the URL you’ve designated. With a Transaction Check, it’s possible to monitor shopping carts or signup forms from the first step to the “Thank You” page.
Remember: Transaction checks run in 5-minute intervals. Use them to monitor specific goal funnels, but supplement them with HTTP/S and other infrastructure checks at regular intervals. You will trigger alerts much faster, and receive accurate technical data one which portions of your infrastructure might be down.
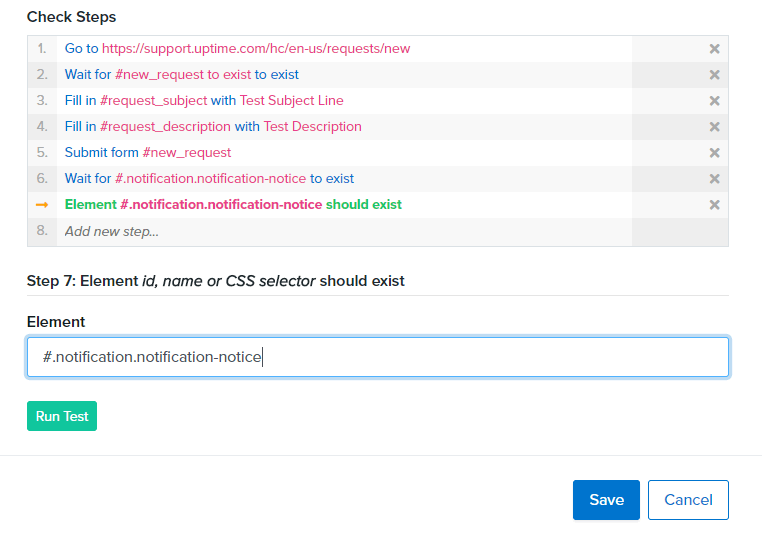
Transaction check screenshot
Combine Transaction Checks with RUM
A Real User Monitoring (RUM) Check measures the user experience of specific goal funnels, and your site as a whole. When combined with a Synthetic monitoring, you gain powerful insights into real user behavior of a specific goal funnel.
A RUM check provides advanced metrics that break down load time by page, device, specific path and more. These advanced metrics provide not only indications of the average real user’s experience, they alert contacts when load times exceed expectations you define.
Clever RUM check users will use data accumulated over time to adjust the threshold for page load times, a value (measured in seconds). Lowering this value alerts your team to potential issues with latency or performance, with a baseline accepted value based on optimal conversion and bounce rates.
Speed Testing
Another commonly utilized check is the Speed Test. A Speed Test will provide a Waterfall containing a visualization of each element, and the length of time it took to load. This graph tells you at a glance which elements are consuming the most resources.
Both RUM and Speed Test checks tell you how long it takes for the user to see something, known as First Render in RUM. The Speed Test is global, however, so you can pick and choose a single location or test from across the globe. If you want to get a feel for what customers in a specific city are experiencing, the Speed Test is one of the fastest ways you have to get that data.
The Speed Test isn’t just a measurement of whether it’s working, rather how is it working? How are the changes your team is making to the site or application impacting your real users? Is the experience slower after a deployment? Use the Speed Test history feature to review past reports. Catching small opportunities to improve the user experience is just as important as monitoring for outages.
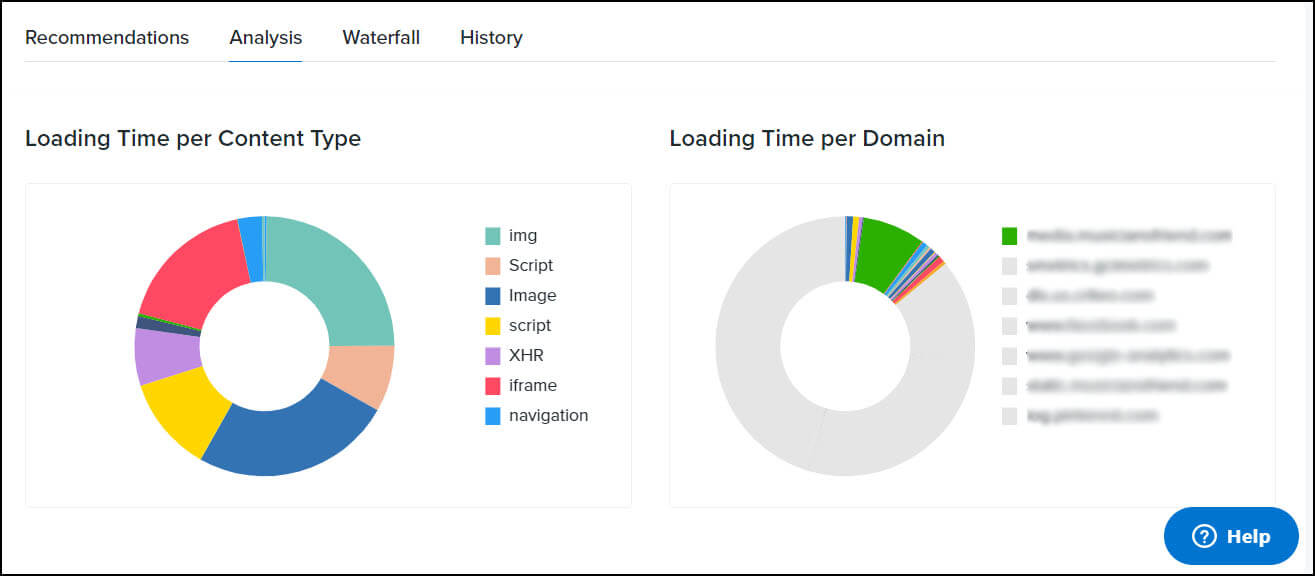
Analysis from Uptime.com Speed Test
Network Performance Monitoring to Detect Unexpected Outages
Unexpected outages either occur outside of our infrastructure (IE a payment processor going down), or something we didn’t plan for or consider initially. Take a moment to see if anything in this list applies to you.
Ping (ICMP)
ICMP is a useful check when you want to look at a particular service’s availability. You might use it to monitor your payment gateway so you have first notice if you can’t accept payments. You can also ping external services critical to communication, like Slack or GitHub, to be sure the resources you need are accessible.
ICMP is not critical to your infrastructure, but it has its uses. You can use it to ping your internal infrastructure as well, ensuring traffic delivery is functioning well and providing an external notification if something goes down. Properly configured, this downtime alert would go to SMS or some other external form of communication accessible outside the corporate network.
Server and Application Monitoring for Complete Protection
There’s a lot to monitor server side to be sure application delivery is as quick as it can be, and always on. The Uptime.com API Check uses multiple HTTP/S Check steps to quickly ping resources using a mix of GET and POST requests. You can review status codes, expected strings, post URL encoded data, and issue OAuth tokens for safer access.
Remember to add extra failsafes into your API check so you can verify functionality.
Is Your Website Monitoring Ensuring Reliability?
The best uptime monitoring system you can design provides smart detection, alerting and escalation. Is your check system ensuring you receive comprehensive alert data your team can put into action?
When you fully utilize Uptime.com functionality in your account, you create a robust monitoring system that issues technical data on downtime faster.
Minute-by-minute Uptime checks.
Start your 14-day free trial with no credit card required at Uptime.com.