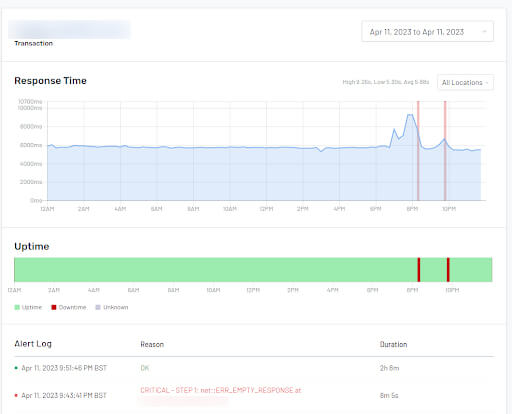
Improved visualisation on Response Time graphs
Uptime.com makes it easy for you when troubleshooting a check that is DOWN.
Response Time graphs now have a light red overlay for the period the check was reported down.
This overlay will correlate the time and date of the alert, as shown in the alert log. The overlay will remain in the historical view, even after the check returns to an UP state.

For more information, please see our documentation on using the improved visualisation on response time graph.
 All Release Notes