
Website Performance Monitoring: 5 Things You Need to Know with Uptime.com
Digital experience relies heavily on the performance of your website, its servers, and your applications. The user experience is most impacted by load time or responsiveness. The fastest applications usually win the day, but there’s more to website performance monitoring than simply measuring speed.
Website performance monitoring looks holistically at your site or application. Not just a snapshot of data, but a trove of alerts, metrics, and records of site downtime that you can use to gauge how the experience has changed over time.
Web performance is a major component to digital experience, if not central to the idea. Google puts a big emphasis on performance, and they give only the best performers access to page one of their coveted search engine.
According to Google, performance translates to:
- Consumer loyalty and user retention
- Conversion rate improvement
- Creating the best possible user experience
Unsurprisingly, we agree. Uptime monitoring isn’t just about downtime. It’s also experience and performance monitoring.
Today, we’ll discuss how downtime events don’t always translate to full-blown outages. Then we’ll look at the performance monitoring toolset Uptime.com users have at their disposal. We’ll discuss what these tools do, how they work, and some important tips and tricks that will help you dig deeper into your own performance monitoring.
Table of Contents
- Not Every Downtime Event Means a 404
- Milliseconds are Money in Website Performance Monitoring
- Minify Won’t Fix Everything
- The Best Website Uptime Monitoring is to Think Smart
- Cleaning Your Site Improves Performance
- Finding Solutions to Web Performance Monitoring
- I Want to Know My Site Responsiveness
- I Want to Eliminate Single Points of Failure
- I Want to Ensure Connectivity
- Put the Emphasis on Web Performance
Not Every Downtime Event Means a 404
First, let’s take a moment to appreciate the sheer scale of Amazon’s infrastructure. Their IT team has some serious challenges ahead of itself, and Prime Day creates even more hurdles with surges of traffic that most of us can’t fathom. It will come as no surprise to anyone in this industry that Prime Day isn’t always smooth sailing.
During Prime Day, Amazon experienced downtime on its shopping carts. Users could still browse the site, and nothing appeared wrong until they tried to add items to their cart. Amazon’s UI informed them that there was an error adding the item, and this outage lasted 2 hours.
Milliseconds are Money in Website Performance Monitoring
Ok, maybe you already knew this, but let’s take a moment to make sure it has sunk in for you.
Two hours doesn’t seem like a ton of time, but Amazon’s stock price dropped 0.5% on reaction. Plus, there’s a reputation cost associated with downtime for an event your company brainstormed. Nowhere was this on display clearer than eBay’s downtime Crash Sale. At this point, downtime on Prime Day is a meme.
Technically speaking, #PrimeDay had some difficulties yesterday – so we’re unlocking our limited time Crash Sale deals. #CrashingPrimeDay
— eBay (@eBay) July 16, 2019
At scale, every minute of website downtime translates to massive revenue losses for any business. But, the big takeaway is that downtime doesn’t always mean a 404 page. A partial outage can still hinder the customer experience, and a support ticket about the issue is the wrong time to figure out something is down.
Multiple checks designed to ping various parts of your infrastructure offer the greatest probability of detection.
Minify Won’t Fix Everything
Some companies have fewer assets to work with, so minifying code and compressing images is a great short-term fix. Balloon those assets or increase complexity of infrastructure and minify’s impact starts to decline. The impact on larger sites comes from delivering your content faster than your competition.
Caching or hosting could be the bigger issues. Caching your site helps to deliver it from a location close to your potential customer, wherever he or she resides. Cloudflare has already made the case for content delivery, arguing that it shortens the physical distance between you and your end user and boosts performance exponentially.
Your hosting choice should prioritize speed and uptime. Every hosting provider is going to guarantee a minimum of 99% uptime, because anything less than that would lose them business. Hosting reviews will help, but you must be thorough in your evaluations and cross-check any available data if you don’t maintain a site on each platform.
The Best Website Uptime Monitoring is to Think Smart
There are multiple points of failure all over your infrastructure. Just look at DNS, which can go down if your provider fails. These points of failure may or may not reside outside your control, but they have the ability to bring down your entire site.
One of the benefits of running a Domain Health Check is to set monitors for some of these points. Ultimately, you’ll want to create a comprehensive audit of your site’s points of failure.
Helpful questions to ask during your audit include:
- Which failures trigger an outage the customer would notice?
- What would directly impact only a part of the customer experience?
- What providers offer infrastructure your business relies on?
- Which team members hold integral knowledge?
The audit’s goal is simple: find what makes your business grind to a halt.
Cleaning Your Site Improves Performance
We were all once that fledgling startup with a site only a few pages deep. Our hopeful hearts dreamed of a future infrastructure too big for our small staff to manage.
Do you remember those days? All the hack redirects and coding you did to make it work and push it live? Memories…
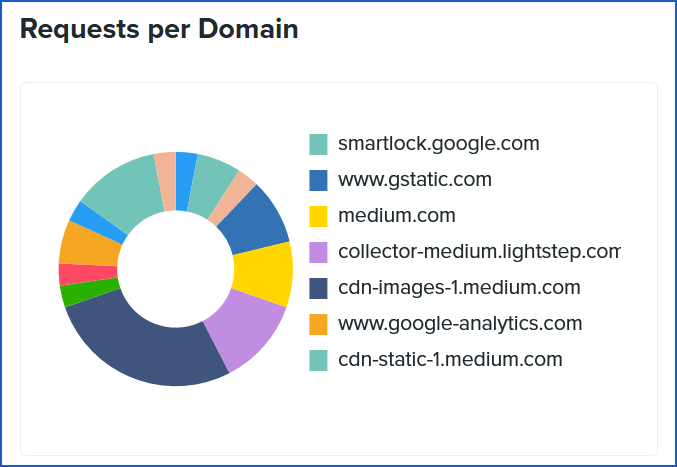
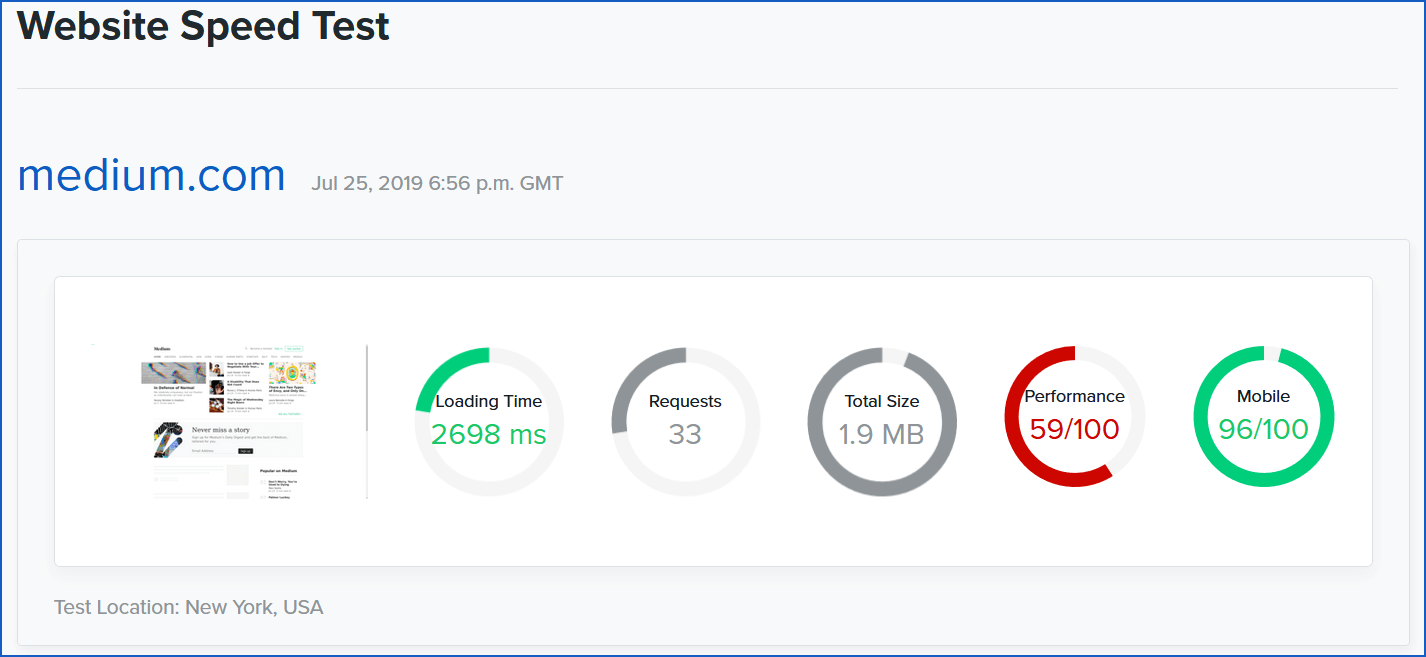
Well, those memories never left and they are slowing your site to a crawl. Use the Uptime.com Speed Test tool to visualize a waterfall of requests, so you can see the time each takes and make strategic adjustments. You’ll need to clean the extra code, properly redirect, and fix your canonical URLs as well. Not just because some SEO company told you to do it, because your end user demands performance.
Finding Solutions to Web Performance Monitoring
A variety of checks allow Uptime.com users to gauge performance, both in the moment and over time. The right check for you depends on what you hope to understand about your site’s performance.
Want to get started monitoring your site’s performance? Check out uptime.com for free for 21 days.
I Want to Know My Site Responsiveness
Site speed is impacted primarily by three factors:
- Web hosting
- Content delivery
- Other Scripts
Your own performance is the hidden fourth factor. There’s a limit to how much damage outside factors can have on a well optimized site. All things considered: it’s best to approach your code with performance in mind. A site that is well optimized won’t see itself impacted heavily by content delivery issues, per se.
Ideally, server uptime monitoring is just the tip of the iceberg. We would recommend that you consider monitoring other aspects of your user experience. A Page Speed Test is another good step, but you can take performance monitoring a step further when you incorporate RUM or even synthetic monitoring into your repertoire.
Why RUM? Real User Monitoring, or RUM, is about tracking the user experience across a specific path of URLs. Analytics provide statistics on what the user did, RUM tells you about the user’s experience along that funnel. The Average Load Time Breakdown is a good example of where RUM excels in visualizing the user experience:
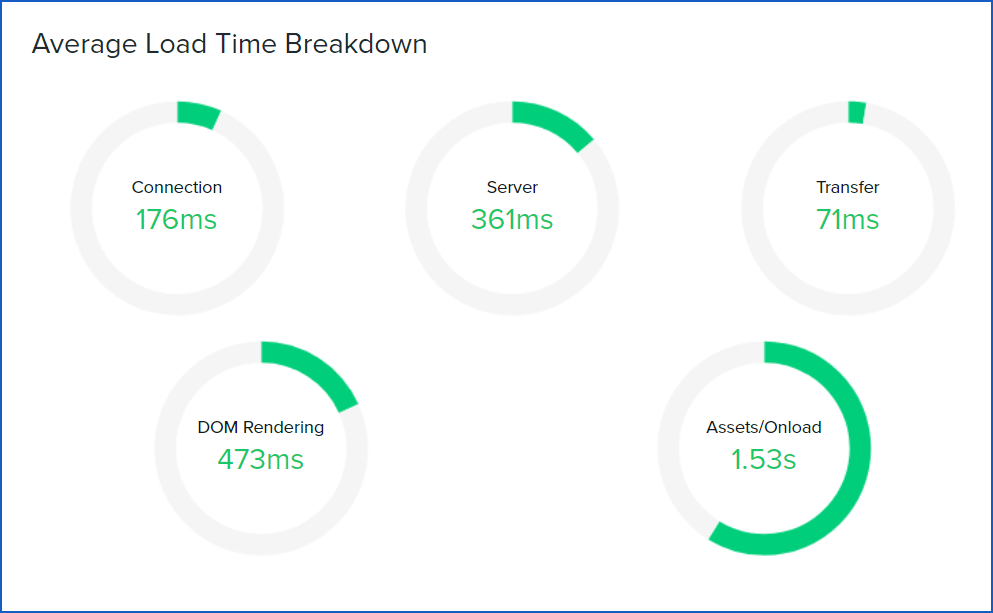
You get an idea of how your site functions as a whole, based on server response, HTML transfer, DOM rendering and the time it takes to fully render the page. You can also track these performance metrics across your goal funnels. The catch? You must have real traffic going to these locations, and if using Uptime.com, an HTML snippet for the tracking code.
Using this method, you can track the performance of conversion funnels that start anywhere (such as your blog or a landing page), and follow the customer through the actions that lead to conversion. You’ll get detailed results, including browser type and first render time.
I Want to Eliminate Single Points of Failure
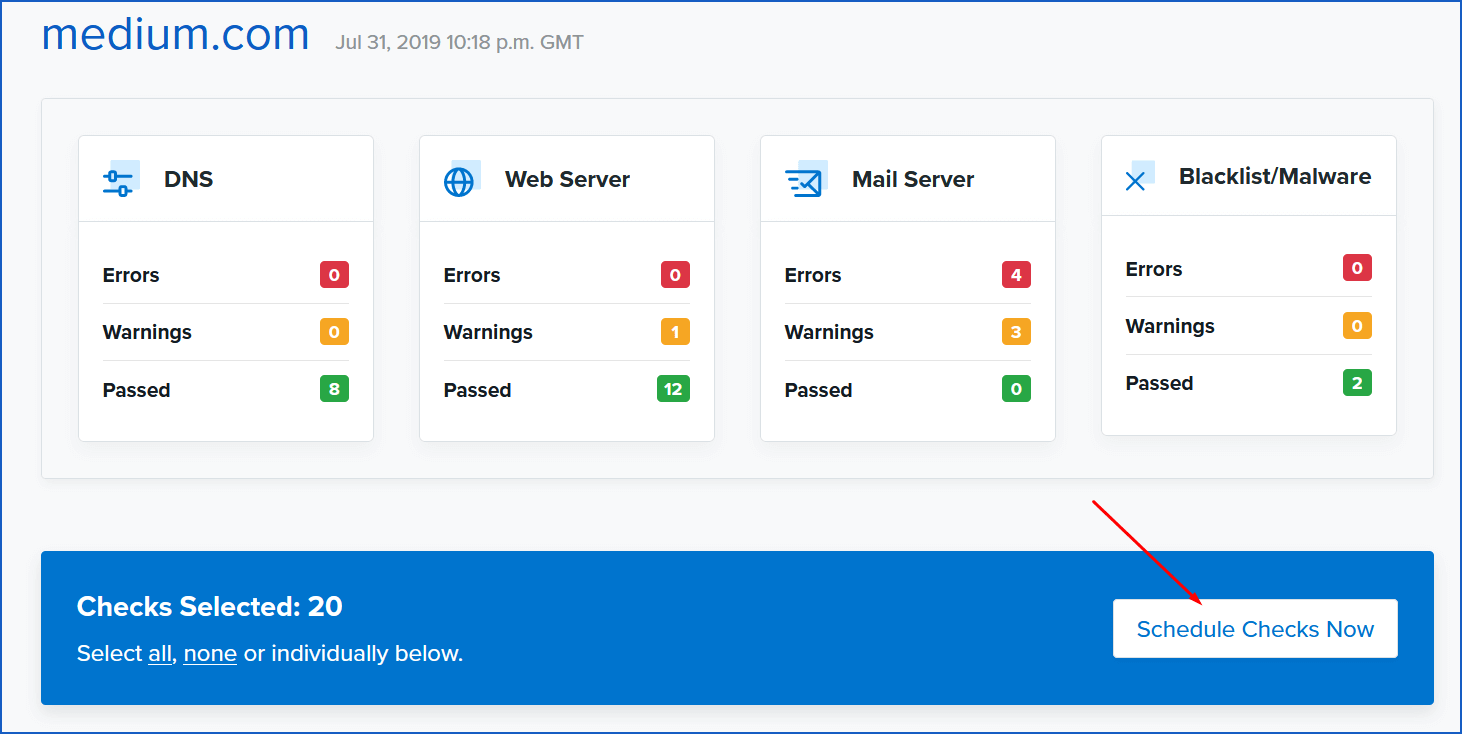
A single point of failure audit is your best course of action. As you prepare this audit, querying every aspect of your infrastructure and personnel, Uptime.com has you covered. Our Domain Health Check will ensure you receive alerts if your SSL, DNS, or server infrastructure experiences downtime. It’s also free, so I personally invite you to use it.
A single point of failure audit is a time consuming task. Take your time and document everything that feels relevant to you.
I Want to Ensure Connectivity
Connectivity can affect regions or locations, such that your terminal can access a resource that mine cannot. We recommend that users try out our Global Uptime test. Another free tool, Global Uptime measures response time and general connectivity from all across the globe. You can expect detailed results from ten locations around the world.
But, this test won’t account for external services. That’s where a Ping ICMP, or an alternative check, will help you. Let’s say your application relies on a third-party NTP (Network Time Protocol) server to carry out specific operations on a set schedule. With that server down, your application could crash or experience unexpected errors. Normal monitoring would show everything green on your end, but an NTP check for that external server would give you your answer almost immediately. (Pro Tip: be sure that your NTP check has monitoring from at least one location geographically close to the server relying on it to spot regional outages.)
Here are some useful checks to ping external services that will help in ensuring connectivity at all times and from all locations:
- DNS (check A, AAAA, MX, CNAME, NS, PTR, SOA, TXT records)
- NTP
- SMTP/POP/IMAP settings (useful for marketing and support emails)
- SSL Certificate Expiry
- SSH
- TCP/UDP
- Domain Blacklist/Malware/Virus
We recommend you use our Domain Health Check to schedule these checks simultaneously.
Put the Emphasis on Web Performance
One of the best ways to improve web performance is to adjust your thinking and your culture on development. Yes, we want to make a product that works and satisfies our customers. We can also do so in a way that improves our development cycles.
Code makes a big difference and companies are beginning to understand the importance of reliability and consistent uptime. Downtime costs. It’s an annoyance that hurts your reputation with consumers who increasingly expect reliability, availability, and performance most of all. The more we make development, testing, and deployment efficient processes, the better the Web and the applications we use everyday.
Putting the emphasis on web performance means releasing when it’s polished, and cleaning up our mistakes. It means accountability. Not always easy but always necessary.
Minute-by-minute Uptime checks.
Start your 14-day free trial with no credit card required at Uptime.com.