
Reporting on Systems: Best Practices and Examples
Reporting on systems is a necessity – whether you are responsible for reporting to internal and external stakeholders, or want to make status reporting accessible for your end users. Integrated tools make reporting a practical extension of your monitoring to save you time without compromising key metrics.
Account Dashboards and Uptime Reports
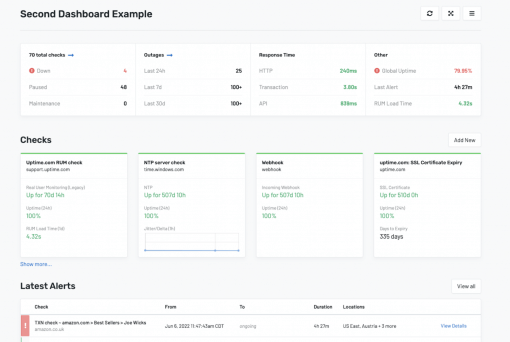
Dashboards are the first thing you see when you login to an Uptime.com account – and your first available type of custom report. Dashboards can show specific checks tagged for specific clients or services, control which alerts are front and center, and display critical system metrics for a high level view of what’s working – and what isn’t.
Use dashboards to organize per check reports
Dashboards are a quick reference, and with full screen functionality and auto-refreshing, they offer a comprehensive view of your systems. Uptime.com is all about drilling down into deeper detail, so click on check cards to reveal uptime and response time for each check over custom time periods, and download report data.
Status Pages: 3 Use Cases
What are Status Pages? Status Pages are most commonly used for public-facing uptime and outage reporting. They serve as a reference and communication platform between your users and your support and engineering teams when they are updating on planned maintenance or resolving an issue. We like to present status pages in a more flexible way to show off their utility for SLA and internal accountability.
Use Public Status Pages to Build Trust
A Public Status Page conveys information on scheduled maintenance, downtime events, and general system uptime to your site or service users. Having one allows you to update your users during outages, and during your incident management process. Better they reference your own page and information rather than reaching out publicly via social media or another outlet.
Public Status Pages create a space for your company narrative during events.
- Add components to your Page to represent the various parts of your infrastructure & communicate their uptime and performance to your users
- Associate a component with a check to display response time and automate the displayed status depending on a check’s state
- Display components, uptime percentages, and metrics in a public or private URL
- Manage incidents with real-time updates and manually control component statuses
Use Public SLA Pages for 24/7 Reporting to Stakeholders & Clients
All three of these Status Page types can be made either public facing or private and protected with basic auth. You can also redirect with CNAME to use a custom URL, and customize pages with html and CSS to match your branding and design.
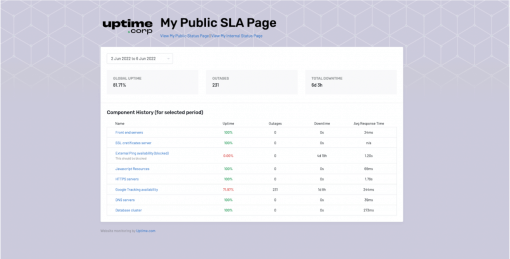
Many of our users add checks for a particular client to a private SLA Page to offer constant reporting on that client’s sites and services. Optionally enable report downloads and historical data for full SLA accountability.
Use Internal Status Pages to Sync Your Team
Status Pages aren’t just front-facing destinations, they are also a powerful form of communication across teams. Use Internal Status pages to report on database and server health, upcoming internal maintenance, and API health.
Your support team will thank you for the insight into the systems. When customers call or write, it’s helpful having those internal metrics on hand for a more accurate picture into problems.
All status page components can be optionally linked to existing Uptime.com checks, but they can equally represent offsite assets to provide a single-stop destination for internal company reporting and alerting. Group components together to report on the health of general sites and services.
*Grouping components is a great way to bring clarity to any status page type, and it can be effective for your monitoring also. Wouldn’t it be great if you could group checks to collectively report on overall uptime for a group of checks or servers? Stay tuned…
Scheduled Reporting to Stakeholders
What good is a report if you can’t automate where it needs to go? Easily accessible status pages are great for providing 24/7 access to some reporting, but sometimes you need to report on a more specific set of parameters to a very select group of people.
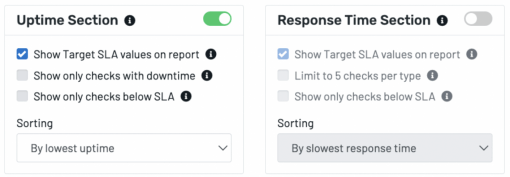
Uptime.com SLA reports are highly adaptable to meet your needs. Select checks and choose to show specific target SLA values and determine visible metrics and report sorting, then easily schedule reports to go out on a recurring daily, weekly, monthly, quarterly, or annual basis based on your needs. You can even choose the time of day the report gets delivered, to make sure it arrives when it’s most convenient.
Integrating Uptime Performance Metrics with Other Reports
Uptime.com makes it easy to create a full reporting suite in a matter of minutes. Especially if you utilize our tag system for easy organization and report creation. It’s a snap to report on your Uptime.com account metrics, but what if you have other systems that also generate reporting?
All Uptime.com report solutions have the capability to download in XLS format for easy integration into existing reporting. We also offer a full REST API that can be used to pull data or create reports directly within your environment.
Regardless of your reporting needs, Uptime.com can help with customizable reports, dashboards, and status pages. Learn more by checking out our solution, and sign up for a 21-day Free Trial today, no credit card required!
Minute-by-minute Uptime checks.
Start your 14-day free trial with no credit card required at Uptime.com.