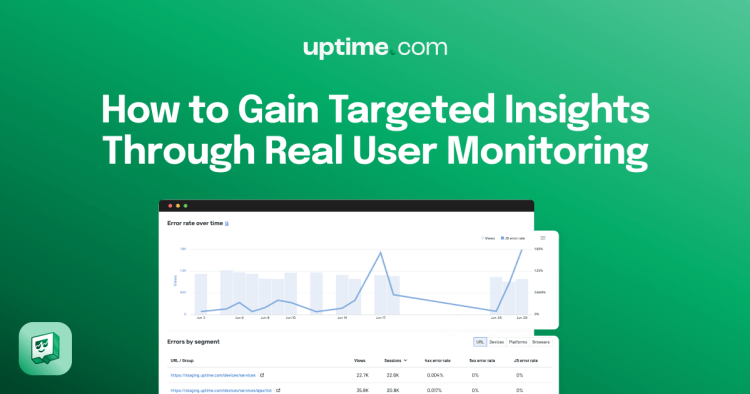
How to Gain Targeted Insights through Real User Monitoring (RUM)
Uptime.com offers Real User Monitoring (RUM) as part of every subscription plan. What is Real User Monitoring? RUM reporting provides a variety of insights into how users experience your website, packaged in a single report that offers an intuitive snapshot of user experiences. While Uptime.com can provide metrics and monitoring of performance, RUM enables real-time monitoring, collecting metrics that show how users interact with your site and how satisfied they are with its speed and stability. This can help identify performance bottlenecks to make extrapolations about user satisfaction, and help make informed decisions on both the development and marketing ends of your organization.
Uptime.com’s RUM monitoring does this by tracking several essential metrics. Page views, time to first paint and time to interactive, Apdex score, AJAX load time, and error rates can identify problem areas with a webpage.

That may seem like a lot of data points to manage. Thankfully, the RUM tools within Uptime.com offer filtering, grouping, and customization options that can help narrow down your results to get actionable insights.
Excluding Bot Traffic
One of the most important filters is the ability to exclude user agents—most commonly bots and search engine crawlers—from your RUM reports. Since bot traffic doesn’t represent real user behavior, it can distort your data. Uptime.com’s RUM monitoring automatically excludes many frequently used bots including Googlebot and Bingbot as well as Uptime.com’s own user agent. This ensures that your performance metrics are accurate to actual human behavior when interacting with your site.
You also have the option to set custom user agent exclusions under the Optional tab when creating or editing a RUM monitoring check. If you are configuring your RUM monitoring to filter out user agents, we recommend checking regularly to ensure that there have been no changes to the user agent for the services that should be excluded.
Tip: it’s not always necessary to use the full name of a user agent when setting exclusions. Uptime supports substring matching, so you can exclude a user agent by simply entering its name, or a base URL when multiple subdomains should be excluded.
For example, if user agents share a common term such as a domain name, you can exclude them by identifying that domain. Entering robot.com in the Exclude Useragents box will exclude all subdomains such as:
- My.robot.com
- Your.robot.com
- Our.robot.com
URL Grouping
RUM monitoring allows you to group similar URLs together for easier data management. This is especially helpful when you need to analyze performance across specific sections of your site, such as blog pages versus service pages. Creating URL groups simplifies reporting, making reports visually cleaner and helping to identify patterns and trends.
Tip: you can use regex to create complex matching for URL groups. For example, adding the following string as a URL group in your RUM check:
/devices/:devices
Will group all pages on your website under the /devices path into a URL Group named devices.
Excluding URL Parameters
Filtering out URL parameters allows you to exclude device types, specific clients such as web browsers, or different URL paths on your website. This can help prevent your RUM data from becoming cluttered with variations of the same page and ensure that your performance metrics remain consistent across different sessions.
Tip: string matching also works when excluding URL parameters to filter out duplicate pages. For example, on an e-commerce site, entering the filter “most_reviewed” would filter out a page with the URL ecommerce.com/products/53627tg7/most_reviewed=true.
What Metrics Are Offered by RUM Monitoring?
Narrowing down RUM report data for clarity can be helpful, but what metrics does RUM monitoring provide? Far beyond simply counting page views or errors, Uptime.com’s RUM reports provide a wide range of actionable data across several key metrics that can identify targets for optimization.
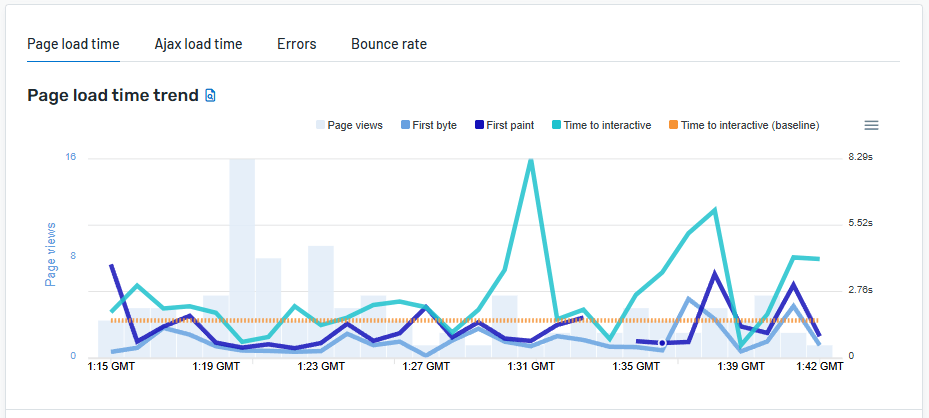
- Page Load Time Trend
- Page load time is the key goal of webpage optimization, and Page Load Time Trend displays a quick overview of important points along the full process of the page being visible and usable. Time to first byte, time to first paint, and time to interactive help visualize the full user experience from request to interactivity.
- AJAX Load Time
- Measures the time to make and process asynchronous AJAX calls for dynamic website updates.
- Apdex
- Provides an industry-standard measure of how likely it is that users will be frustrated by the overall page load time, categorized as Satisfied, Tolerating, or Frustrated.
- Bounce Rate and Error Rate
- Tracks whether users are leaving the page without interacting with it (bounce rate) and if users are seeing errors (4xx, 5xx, or Javascript).
- Page Load Time Breakdown
- Offers a detailed breakdown of communication times between endpoints, segmented by Connection, Server, Transfer, Client, and Assets.This can help identify problem areas in the connection process.

RUM monitoring in the Uptime.com platform is an excellent tool for gaining valuable real insights into the performance of your website from your user interactions. The many data points available work together to provide a complete picture of what your users can expect, and where their experience can be improved. Using targeted insight methods will ensure that your RUM data is as streamlined and easy-to-use as possible.
Interested in learning more about Uptime.com’s Real User Monitoring? Check out our Knowledge Base for articles on Real User Monitoring setup, logic, and definitions, data, reports and more. Not an Uptime.com customer and interested in trying out RUM? Sign up for a 14-day free trial and test Real User Monitoring for free, no credit card required!
Minute-by-minute Uptime checks.
Start your 14-day free trial with no credit card required at Uptime.com.
 Uptime.com Blog


