Don’t Let Third-Party Providers Bring Your Uptime Down
False positives are sometimes real alerts in disguise. And they can contribute to some major downtime if you don’t resolve them quickly. They can also put quite a strain on your resources trying to figure out why they’re happening, and if you work with third-party providers, errors may be even harder to locate.
Is it Real? Or Is it Fake?
You’re minding your own business and suddenly you receive a few alerts. You do an initial investigation and verify that your site and systems are running as expected, but the alerts aren’t stopping so you start to strategize. Your check is set to a standard 5-minute recurring interval, should you reduce it? Perhaps an increase in frequency will help you validate the error?
The answer may not lie in the interval.
Step 1: Ruling out False Positives
From a cursory glance, your site appears to be UP. So how do you confirm that you are in fact looking at a legitimate alert and not a false positive?
The answer? Check your sensitivity.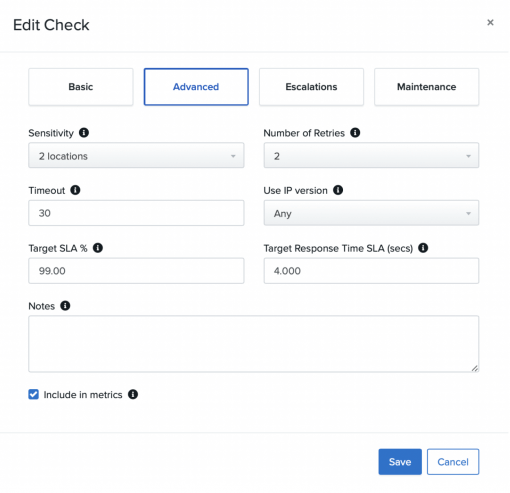
Let’s look at the anatomy of this check.
Sensitivity is connected to your check’s locations. If you have configured 3 probe server locations for your check, then we recommend a sensitivity of 2 – 2 locations must fail for the check to be DOWN.
If you have 4 locations, we recommend a sensitivity of 3 and so on. This helps protect against network anomalies that may send your check DOWN.
You will also want to check the Number of Retries, or how many times the check will retry from each location before it is considered DOWN. If your sensitivity and retry settings aren’t contributing to the likelihood of a false alert, it’s time to drill down.
Step 2: Dig into Real-Time Analysis
Your Alert Log and your check’s Real-Time Analysis will give you a lot of useful information that will help you authenticate your alert.
Let’s say you had a Transaction Check fail at a Go To URL Command Step. It failed with a Navigation timeout error. When you review your real-time analysis you get a screenshot of the page and the step element for a visual verification of the incident as well as browser console data.
These details can help.
The Go To URL step expects the Load event to be fired after the entire page has loaded, including all dependent resources, stylesheets, and images. We know something prevented the load event from firing for at least 30 seconds. Even if the URL is up, something is affecting website performance and could trigger downtime.
Step 3: Location, Location, Location
A quick way to validate your alert is to check how many of your locations went down. We assume at least 2 if you are following our best practices but are ALL your locations down? Or just the minimum sensitivity? Did they failing at the same time?
The more locations down, the more likely the alert is an actual issue. So now for the big money question. Your systems are fine. Everything is fine. So what’s causing the downtime in your monitoring service?
If it’s not Me, and it’s Not You, It Must Be Them
Does your company work with third-party providers? Ours does. Most companies do. Oftentimes functions like payment portals, apps, even contact forms are run by companies outside your infrastructure.
These companies have sites with transaction pathways, elements, and components that are not impervious to downtime. If something on their site goes down, it could affect your Uptime and your user experience.
No Paper Trail
Third-party downtime can be challenging to spot within your own system because third-party assets likely aren’t reporting to your system or being recorded in your logs.
There are 2 Strategies to implement here to improve your visibility and enhance your alerting structure.
SLA Accountability
We’ve talked before about the importance of creating Service License Agreement (SLA) reports and Public SLA pages to report accurately and transparently on your own SLA guarantee or accountabilities.
Heck, we’ve even configured fields to funnel SLA requirements straight from checks to our reporting feature. If you’re taking SLA seriously on your end, you should expect the same of the providers that you contract with.
- What are their accountability metrics?
- Are they obligated to report incidents?
- Do they have a private Status Page so you get 24/7 visibility?
Monitor Your Providers
It’s as simple as setting up a basic HTTP(S) check to help monitor the tools and services you use. A basic 200 OK validation on a mission critical endpoint can go a long way in ruling out the culprit if you suspect third-party downtime. As a performance monitoring company, we recommend incorporating some Basic Checks testing your third-party sites into your idea of monitoring infrastructure.
When it comes to 360º monitoring, don’t just think internal and public-facing, think outside your site and include some checks for the companies you use to create elements of your website.
Implementing this technique can potentially cut your investigation time in half when an incident strikes.
Setting up 360º monitoring that covers all the bases can be a big task. Our support team has gotten pretty good at it. Reach out to us at support@uptime.com to optimize your account. Just getting started? Check out our 14–day free trial (no credit card required) and test our solution for yourself.
Minute-by-minute Uptime checks.
Start your 14-day free trial with no credit card required at Uptime.com.