Website Performance Monitoring: What Are You Really Paying for?
Have you found yourself confused by the plans and pricing around website performance monitoring? Are you using the features you’re paying for?
Finding the right service involves many moving parts. Very often, that journey begins with a quest to find a simple up or down monitoring tool for external verification. It’s only after you take that first step into the market that you begin to notice additional features and expanded functionality.
In a populated market like performance monitoring, which products and services are going to provide the best coverage and also prepare you to meet your SLA obligations?
Today, we’re setting out to help answer the question of what you’re really paying for when it comes to this type of service.
The Check Types and What They Cost
Basic features like HTTP(S) monitoring checks and alerting are the bread and butter to monitoring, and usually determine whether the provider’s offering is even up to the task. There are differences in how external monitoring providers monitor a website, how they alert you, where they monitor from, and of course how they charge for all this functionality.
Let’s begin with the backbone of monitoring: the HTTP(S) check.
HTTP(S) Monitoring and Synthetic Checks
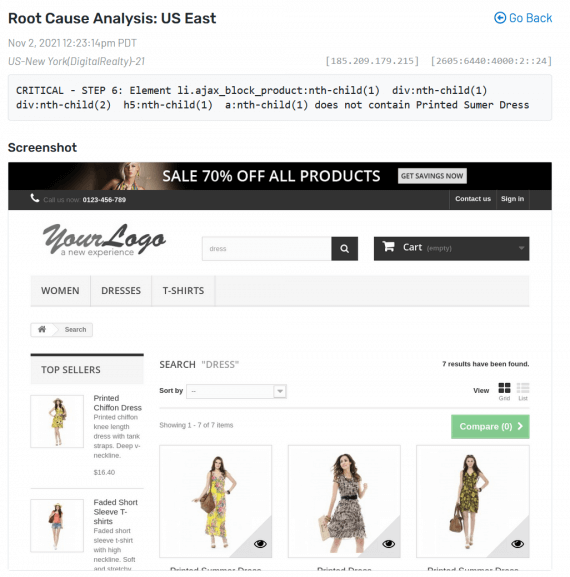
Our opinion is that transaction and HTTP(S) monitoring are the bare minimum. These checks cover critical user pathways step-by-step like login pages, and checkout processes, while giving your team as-it-happens insights into downtime.
A neutral third party like Uptime.com can provide a standard with which to measure your site’s performance and uptime, and ultimately help you to improve the user experience and reliability of your platform.
Critical and Can’t Live Without Features
These features can make your monitoring life more manageable, or add extensive options to let you monitor almost anything under the sun.
Programmatic Access
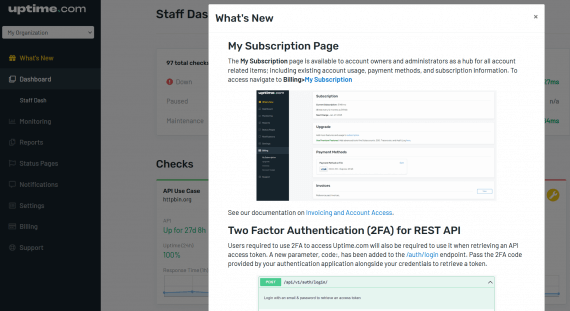
One nice benefit is access to the API so you can manage or deploy checks as part of your workflow. Uptime.com is constantly updating our REST API, and we maintain a Github containing lots of examples to get you started. Bonus points if your provider supports a system like Terraform.
Performance Monitoring
Real User Monitoring (RUM) is becoming a necessity as the competition for milliseconds heats up. Users want access to the content you serve, and they want it as quickly as possible. As your organization starts branching into load balancing and content distribution, RUM will become an important tool for ensuring your site remains speedy.
Reporting and Accountability
Your Service Level Agreement spells out the basic boundaries your team has to work within for downtime. You need accurate third-party reporting that reflects the proper state of downtime. We go a step further, offering status pages and fine grain control over alerting. Place checks into maintenance state, ignore irrelevant alerts, and manage incidents via a public-facing platform.
Security and Access
It’s easy to overlook provisioning access to your users, but your security team likely has some restrictions in place that make finding a provider tricky. Will they allow 2FA? Can you utilize SSO? You may also need features like subaccounts to help divvy up usage or define teams.
Admin and Management
How easy is it to provision new users, what does a permission structure look like? Can you have contacts for billing, and how does that system work? These important considerations can help your organization get up and running faster as you look to adopt a full monitoring suite. Providers who have experience working with enterprise billing can be a huge help in acquisitions so you’re not stuck waiting for payment to process while your site goes unmonitored.
Branching into Other Check Types
From there, you need to ask yourself about points of failure that could affect the user experience. Other basic checks, like DNS or domain expiry checks, offer protection for those gaps. While API checks and RUM checks are more advanced and aimed at different aspects of the user experience.
Explore the check types your provider offers. The more you use, the better value you’ll get.
Costs and Considerations
It’s important to understand how you’re being charged to use your monitoring service. Almost everyone in this market, ourselves included, offers some form of introductory package with add-ons you can apply to ensure you have the allocations you need to get the job done.
Our model is a subscription that covers all usage allotted to your account. If you pay for 100 checks, you can run those 100 checks at minute-intervals all month long and your costs will remain the same.
Other providers charge by page view or by interval, some gate faster monitoring or geographic selection behind higher costs. The best advice we can offer here is to price out the service, and when dealing with per page or per interval usage, assume you need more than you think you do. Look at your monthly average page views and consider doubling that to accommodate for high traffic periods, like big sales or busy times.
Location, Location, Location!
The point of external monitoring is to confirm downtime from outside your infrastructure, and to provide first response capabilities. How you get there can make a big difference. For example, our service allows you to select a specific geographic location (such as US West, located in Los Angeles). When locations report as down, you benefit from analysis that identifies which regions went down when.
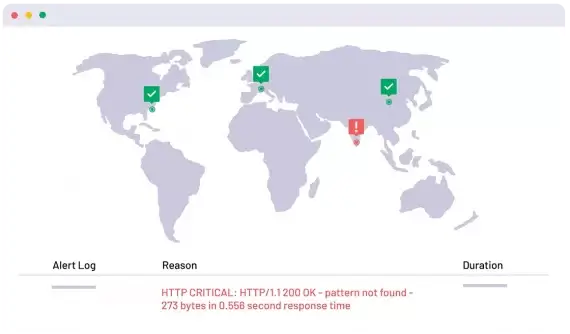
That extra information can tell you a lot about regional outages, and the timeline of the service failure. Especially internationally.
Granular control over the locations you can choose to monitor from, offers the most precise geographical outage detection. Our platform uses consecutive location monitoring within each interval, so every location you select is continuously monitoring your platform – if you set 5 locations for a 5 minute interval, each will run after the other giving you ~1-minute coverage for each test. Alternatives to this approach monitor from a new location only after the first location goes down.
While we are on the subject of location, we should briefly touch on alert delivery. We recommend that you integrate with a third-party provider (Slack and Microsoft Teams being two popular options) to field downtime alerts.
Can your provider’s alert delivery work for your team setup? Does your provider integrate with your existing systems, and do they deliver metrics and alert data?
Alerts and Alert Data
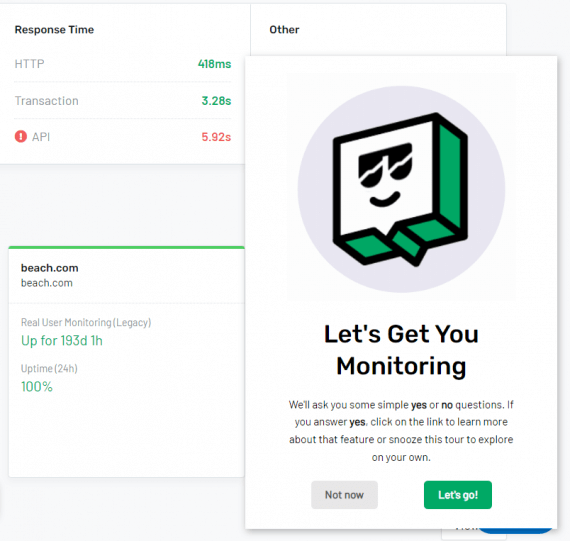
You’re paying for the alert data. How is it presented to you? Is it easy to analyze the problem? Can you gain insight into what each location is seeing? Are you seeing a response as necessary? Do you get specific server codes? The more data, the better informed and ready to act you will feel during a major outage.
Uptime and Reliability
There are 730 hours in the average month. How much of that time was your provider down? You NEED them to confirm your site’s uptime, so reliability should be top of mind.
Another way to phrase this is: you’re paying for your provider’s downtime and your own.
We recommend you begin with your provider’s status page, and examine the previous 30, 60, and 90 days for a feel of what the service’s reliability might look like. Additionally, we also suggest you inquire about a disaster management policy when looking to sign up. How the provider responds to an outage, and what their plans for continuity of service look like can inform you on its reliability. You may also seek out SLA agreements for assurances the service will be there when you need it.
Your provider’s release log (more on this shortly) is a good source of information about the provider’s infrastructure and can lead to some educated guesses about your provider’s development. A slowdown or gap in updates could signal larger features incoming or system instability/lack of growth.
Product Development
The story of a service is in its release notes, meaning you can follow the roadmap and see what the service prioritizes as it develops. More updates indicate a more active development team. With updates, size does matter. Are gaps in deployment bookended by big features?
Are the features in development or recently deployed useful to your team? You can learn a lot about a provider’s direction if you examine their recent releases in the context of your own needs, the more features you use, the better your value..
Product Support – More than an Afterthought
You can’t afford to wait days to find out if your downtime is legitimate. When you need help, support makes all the difference. Not only the support people who handle your requests, but the service and documentation that help explain what you are doing.
Onboarding Your Users
Documentation and onboarding are underrated when it comes to onboarding everyone on your team, especially those who come in after you have adopted a service.
“Easy to use” shouldn’t be just a marketing slogan. Clear UI design incorporates documentation and onboarding techniques your team needs to get everyone ready to use the service.
Getting the Best Value from Web Monitoring
To get the best value out of your web monitoring, use as many features as you can. From the locations monitoring your service to the checks themselves, branch out and explore different check types to plug those monitoring gaps. Try out the support when you need it, and explore documentation.
One easy method to stay apprised of new updates is to subscribe to your provider’s blog or status page. You will get real-time details on changes made to the system, and more insight into using the service you purchased.
Minute-by-minute Uptime checks.
Start your 14-day free trial with no credit card required at Uptime.com.