Uptime Monitoring
Incidents Happen. Receive Alerts with the Best Uptime Monitoring Service
Respond to outages before your customers notice and prevent loss of business and revenue. Try Uptime.com - the industry's authority for uptime monitoring and website performance monitoring!
Trusted by the world’s premier organizations
Ensure your sites are available worldwide 24/7/365.
Detect website outages or performance issues across your sites before yours customers. Our advanced scheduling platform can run checks around the world in as low as 30 seconds. Avoid false alarms across sites with our advanced alerting logic that prevents false alerts. Associate individual checks into Group Checks to get updates on your system-wide uptime and website performance.
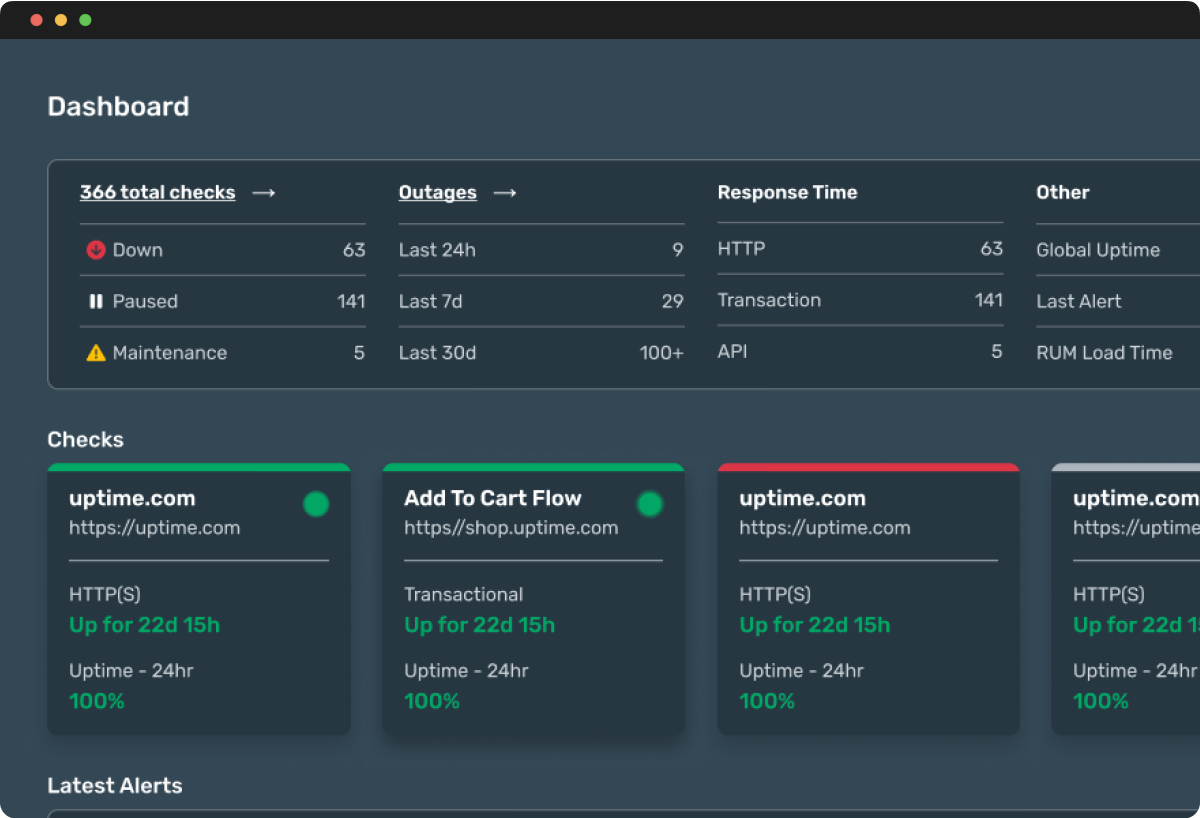
Have an eye on it all. Dashboards for every check, for every user. Unlimited.
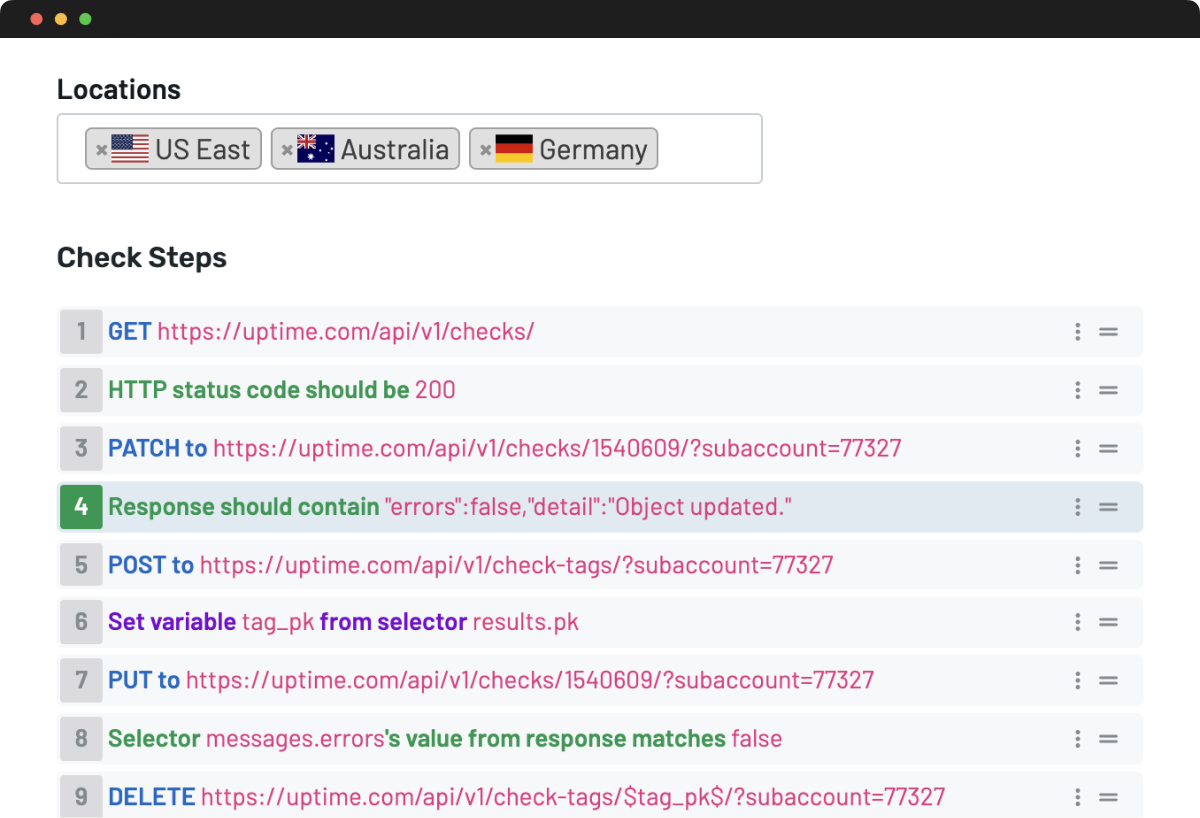
Here, everyone gets full access without any extra charges – enjoy unlimited dashboards and reports with every account. Choose from dozens of checks that monitor everything related to the performance, health and downtime of public & internal websites, applications and services. Configure sophisticated uptime monitoring checks without sacrificing simplicity. Quickly pinpoint issues with funnels, flows, and forms with our no-code approach to transaction checks.
Monitor Public and Private Sites from anywhere in minutes.
Reliably test public websites for speed and performance from hundreds of global monitoring locations -- while private probe servers monitor intranet apps or internal sites behind firewalls. Monitor services anywhere they are running. Deploy our Private Location monitor to enable visibility in Private Cloud or leverage our extensive Public Cloud Locations for complete visibility.
Advanced features accessible to every user and team.
Global Observability Network
Access the largest global observability network that is growing and expanding constantly.
Advanced Notifications
Receive advanced alerts with root cause and advanced details on the alert failure.
Real Time Analysis
Dive deep in to failures and errors when checks fail to enable real-time troubelshooting.
Maintenance Windows
Configure maintenance windows to control monitoring and alerts during maintenance events.
Response Times
View response times and availability data in dashboards and for every check.
Mobile Push Notifications
Install our state of the art native mobile apps available for iOS and Android.
Be alerted while you're mobile. Mobile-first Incident management.
Get notified instantly to monitor uptime on the go.


"Uptime.com allows us to monitor our systems externally so we can detect failures quickly and meet our customer’s SLAs. We wanted a system that was reliable and wasn’t going to wake up our engineers in the middle of the night with false alarms."
Matt Soler
Director of Infrastructure & Security - SocketLabs