15 Ways to Use the Uptime.com HTTP(S) Check Effectively
Uptime.com checks can test anytime, from anywhere, to catch the website downtime incidents you need caught. With worldwide probes, or through private locations that monitor your internal network, we reliably detect outages and monitor performance across your websites, applications, servers and infrastructure.
Read on to explore 15 use cases for the HTTP(S) check type.
Table of Contents
- Monitor Any Publicly Accessible URL or IP Address
- Monitor for SLA Accountability
- Monitor for Uptime
- Monitor a Proxy
- Monitor Behind a Firewall
- Monitor a Basic Auth Page
- Monitor a Router or Server
- Monitor an API Endpoint and Retrieve a Response
- Monitor for a Script
- Use RegEx with HTTP(S) Checks
- Pass an Access Token
- Monitor Internal Assets
- Combine with RUM and Test for Response Time
- Check that Redirects are Working
- Monitor a Specific Port
HTTP(S) checks validate if a server is up or down, while reducing the possibility of false positives. When you need continuous monitoring, HTTP(S) is your go-to check type. Providing configurable 1-60 minute intervals, these checks form the monitoring backbone for most systems.
Monitor Any Publicly Accessible URL or IP Address
HTTP(S) checks excel at monitoring your URL or IP address. They look for server code 200 OK, and are successful until they encounter a code other than 200 OK. Our most widely used check type, HTTP(S) is fundamental as you build out your monitoring system.
Pro Tips for HTTP(S)
- Stagger checks at various intervals
- Escalate checks to specific contacts
- Monitor URLs deeper than your homepage (downtime can strike anywhere)
Monitor for SLA Accountability
All check types capable of reporting response time can report website downtime or response time against a baseline you define. Use SLA% or Target Response Time SLA fields in the Advanced tab of your HTTP(S) check to define these values. These measurements will be available in SLA reports and their scheduled variants.
Monitor for Uptime
Often, an advanced check such as API Monitoring or Synthetic (Transaction) Monitoring will be needed to test a specific customer flow. An HTTP(S) check can help supplement this monitoring. Add one-minute interval HTTP(S) checks to test for a specific part of your flow, such as an item page on an eCommerce website.
You will catch the initial website downtime, with the additional data of the advanced check’s alert if it is also triggered. You will know what is down and how many steps the advanced check successfully completed, allowing you to zero in on the problem.
Monitor a Proxy
Lots of organizations use proxies to regulate usage of internal services. IT will be glad to know Uptime.com can help. You can run an HTTP(S) check by entering a complete proxy URL, such as http://user:pass@myproxy.com:8888 into the Optional tab under the Proxy URL field.
Monitor Behind a Firewall
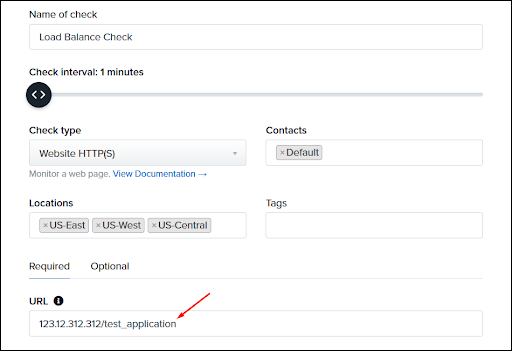
Server load balancing may be distributing traffic across multiple publicly accessible addresses, and it is important to monitor each address for uptime. You will likely need more than one HTTP(S) check for this use case.
First, create a check that monitors the public IP address or DNS host name of your load balancer. Configure a second check directly for the web server’s origin IP address or DNS host name, not the load balancer IP address or host name.
Setup looks like this:
Step 1
Tell Uptime.com to go directly to the server origin IP address that hosts the application/domain.
Step 2
Specify a Host HTTP header:
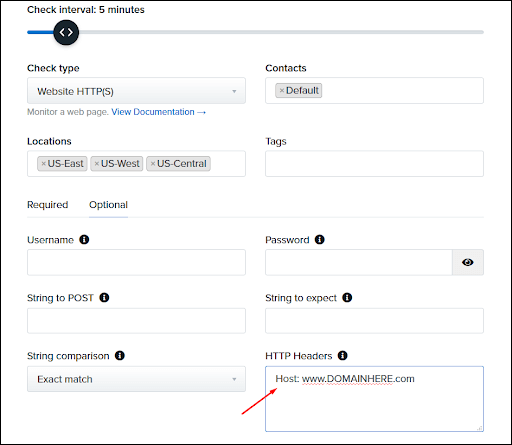
Note: Override the Header with “Host” to distinguish between the origin IP
- Use the Run Test button to confirm setup, and deploy when you’re ready!
Monitor a Basic Auth Page
Basic Auth is great for development testing, API’s, and general semi-protected access. If you have a testing site, Basic Auth is a simple method for securing it. Use the Username and Password fields for authentication to see if your site is up and running.
Monitor a Router or Server
There are two methods here that work. If you enter an IP address into an HTTP(S) check, you get a check that looks for 200 OK and goes down on any other status code. If you use Ping ICMP checks, you can also measure response time to receive 5 packets of data. Combined, you can gauge performance and website uptime with a little more precision.
Monitor an API Endpoint and Retrieve a Response
Some hidden tech for you: an API check’s GET request is essentially an HTTP(S) check. Both are capable of sending and receiving a response. You can use your HTTP(S) check to monitor API endpoints for a specific response at one-minute intervals. Neat!
Monitor for a Script
Take your HTTP(S) check to the next level and use it to confirm a script on your page. Here’s a use case for Google Analytics, but it works with tracking pixels and blocks of HTML as well. Just remember to test, and always build based on the Raw HTML of your website.
It is important to note that an HTTP(S) check “sees” the URL similarly to cURL or a text-based browser. A transaction check is best suited for validating assets rendered properly, but HTTP(S) checks work well for validating code snippets.
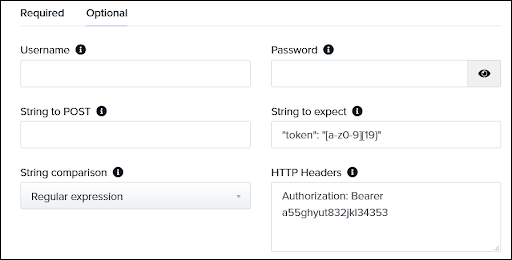
Pass an Access Token
If you need to pass an access token, or some other parameter, you can use the HTTP Header field under the Optional tab. Here is a basic test you can use with httpbin.org/bearer:
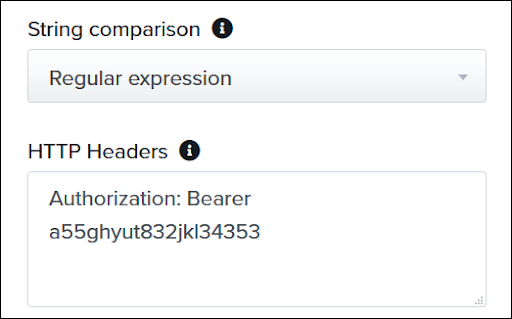
This tip is especially useful when combined with the string to expect field, where you can pass a token and expect a response from an API endpoint.
You can’t change the user-agent with our check types, but the HTTP Header field offers various ways to check website status and receive updates.
Use RegEx with HTTP(S) Checks
You can utilize RegEx for matching more complex strings or patterns, usually when searching for a substring. Useful when you need to verify numbers, or a specific value based on a string of characters. Try it out with our example available here.
Monitor Your Internal Infrastructure
This use case requires either allowing our probe servers access on your side, or working with private location monitoring. HTTP(S) checks can be used in combination with these allowances to monitor assets seated behind your network’s firewall, such as company bulletin boards, internal messaging, and other applications.
Combine with RUM and Test for Response Time
RUM (Real User Monitoring) is our suggested check type for website performance monitoring. It offers real user performance data broken down by location, browser, and device. However, HTTP(S) checks offer server performance monitoring that often determines how quickly assets are loaded.
Pro Tip: Mix Check Types
When you combine Uptime.com check types you get more precise details into your site and its infrastructure.
Check that Redirects are Working
The HTTP(S) check will follow a maximum of 15 redirects, making it a useful tool for measuring when redirects are working. Want more? Try an API check.
Monitor a Specific Port
Quite often, you may want to monitor a specific port like 443 or 8443. To do so, you will need to do a bit of testing, but setup usually looks like this:
Use the https version of your URL, and append “:PORT#” to the end of the URL, where PORT# is the port’s number. As an example, you can monitor:
https://subdomain.myurl.com:443
BONUS: Monitor and Validate SSL
The Uptime.com SSL check is useful for monitoring your SSL certificate expiry, but what if you want to identify an issue with an HTTP(S) connection? The HTTP(S) check can monitor a URL and validate its SSL in one-minute intervals.
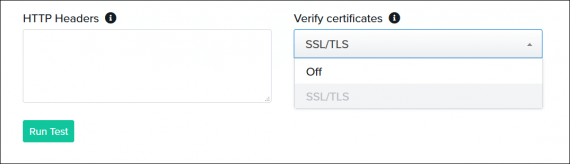
Click the Advanced tab, and be sure that HTTP(S) check 2.0 is enabled.
Return to the Basic tab and click Optional. You can enable or disable SSL validation here.
HTTP(S): Your Monitoring Multitool for Success
Monitoring for website downtime and performance is a never-ending task challenged by the growth of your business. You need a method to reliably detect any (and every) outage or performance incident across your websites, applications, servers and infrastructure. You need validation of those results systematically to remove false positives.
You need 360-degree monitoring designed for your infrastructure.
When you do run into problems, trust that Uptime.com has your back. Our powerful HTTP(S) check is simple to setup and flexible in its usage. Our fast and responsive support team is ready when you run into obstacles, so you can spend less time finding help and more time finding solutions.
Minute-by-minute Uptime checks.
Start your 14-day free trial with no credit card required at Uptime.com.