Trusted by the world's premier organizations.
Our monitoring solutions provide unmatched visibility and availability, empowering engineering, operations and SRE teams to monitor & respond to their most essential services.
Don't wait for user reported errors—continuously test the availability, performance and functionality of your website's critical user journeys completely code-free.
Our monitoring solutions provide unmatched visibility and availability, empowering engineering, operations and SRE teams to monitor & respond to their most essential services.
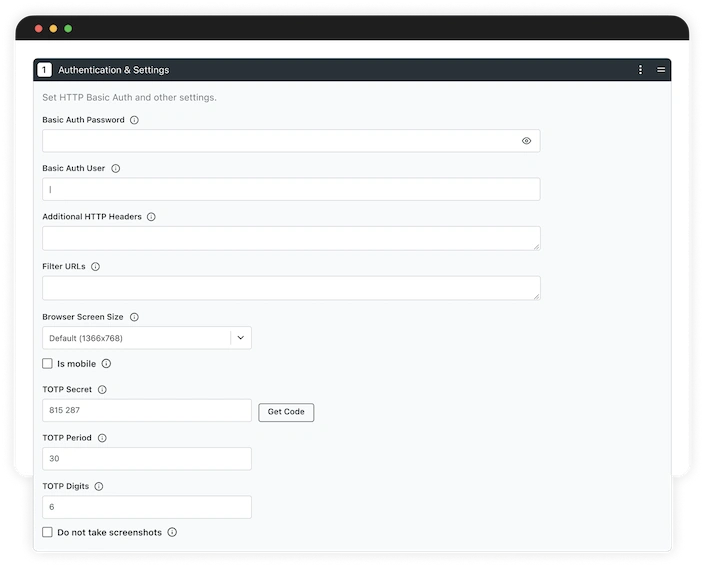
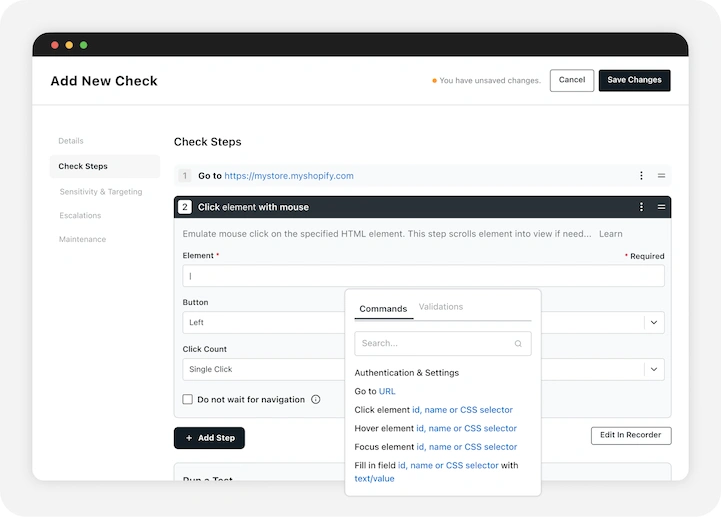
Our built-in editor, equipped with field suggestions, creates a no-code approach to transaction checks. Simple commands and easy-to-read statements create an intuitive approach to monitoring a given flow interaction.
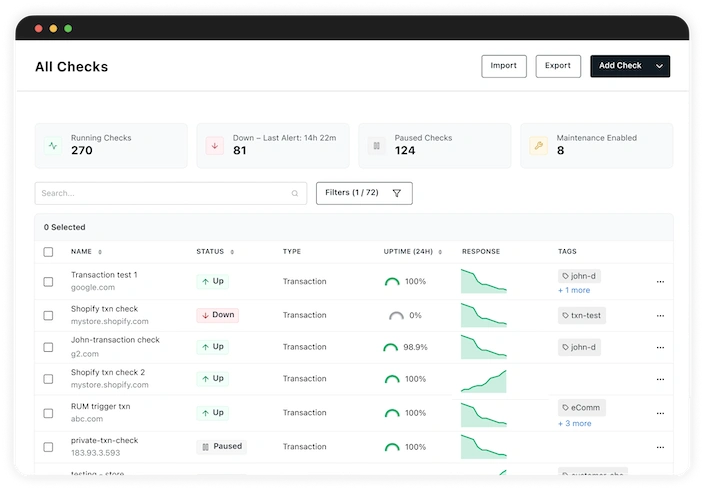
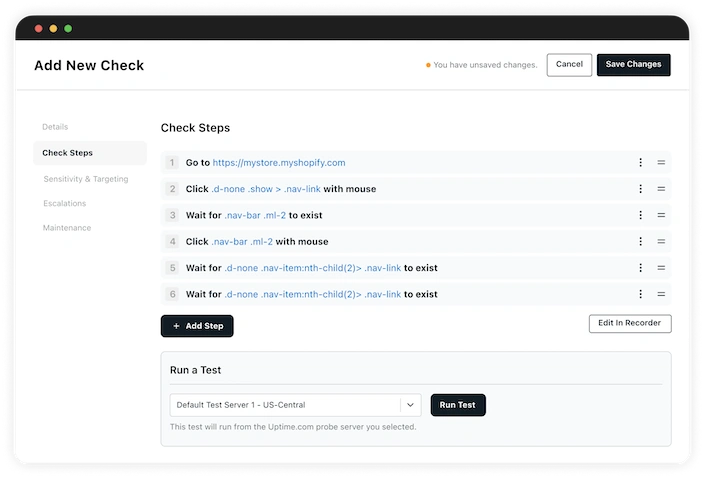
Add new checks quickly
Instead of waiting until a development team is ready to work on monitoring, anyone on your team can create new checks in the browser using Uptime.com's easy-to-use transaction recorder.
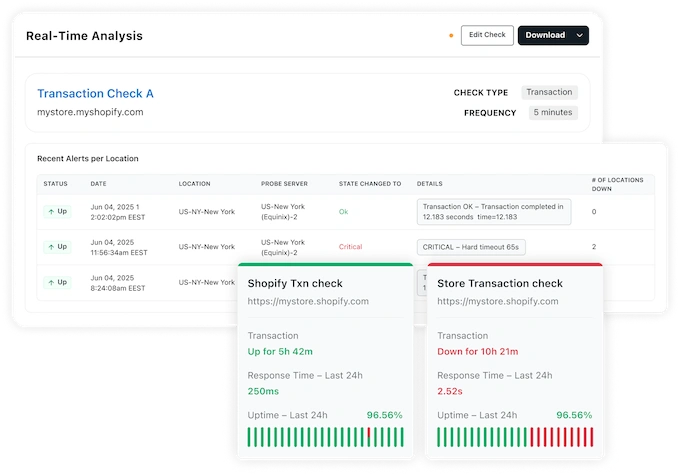
Automatic root-cause analysis
Our advanced root-cause analysis and screenshot on error provides immediate value and clear root-cause for actionable alerts and failed steps in the transaction.
Add Advanced validations and checks
Add assertions and element validators to ensure page components are loaded properly and ensure complete end to end page completion.
What is synthetic monitoring?
Synthetic monitoring simulates user behavior and interactions on a website. It uses automation to perform actions, like clicking on links, filling out forms, and navigating through web pages, to test a website's availability, performance, and functionality.
Synthetic monitoring provides businesses with a way to proactively detect and address issues before they impact real users, measure website performance, and track key metrics such as total and individual step response times.
How does synthetic monitoring work?
Synthetic monitoring works by simulating user interactions with a website or application. Businesses create scripts that define the actions to be performed and the parameters to be monitored. These scripts can be customized to simulate different user scenarios, such as logging in, making a purchase, or browsing through content.
What is the difference between synthetic monitoring and real user monitoring?
Synthetic monitoring involves simulating user behavior on a website. It uses an automated tool to perform the same steps a user would take to complete an action, like logging in or filling out a web form, and records the results.
Real user monitoring, on the other hand, involves tracking the behavior and experiences of actual users as they interact with a website. This type of monitoring typically involves tracking user sessions and collecting data about page load times, response times, and other performance metrics.
Synthetic monitoring is useful for proactively identifying and diagnosing issues before they impact real users, while real-user monitoring provides aggregated insights into how users interact with a website in real time. To cover all possible scenarios, it is best to use both.
Why do you need synthetic monitoring?
Synthetic monitoring is beneficial to any website or web application. Here are a few reasons:
What are the limitations of synthetic monitoring?
Here are some of the best practices you should follow when creating transaction checks:
What are example synthetic monitoring use cases?
Synthetic monitoring can be used to test a wide range of website and application components and scenarios, including:
How to choose the right tool?
For an effective website monitoring solution, you must have complete visibility into your applications around the clock. This involves using three types of synthetic monitors:
Uptime.com is the ideal monitoring solution for businesses of any size. It offers an easy-to-use platform that doesn't require coding expertise and can accurately recreate real user experiences using browser-like capabilities. With its comprehensive monitoring capabilities, you can proactively identify and resolve website issues before they impact your end users. Plus, our 24x7 customer support team, consistently rated as the industry's best, is always available to help you resolve any incidents.
Become one of our happy customers and keep your visitors to your website happy with Uptime.com.