Trusted by the world's premier organizations.
Our monitoring solutions provide unmatched visibility and availability, empowering engineering, operations and SRE teams to monitor & respond to their most essential services.
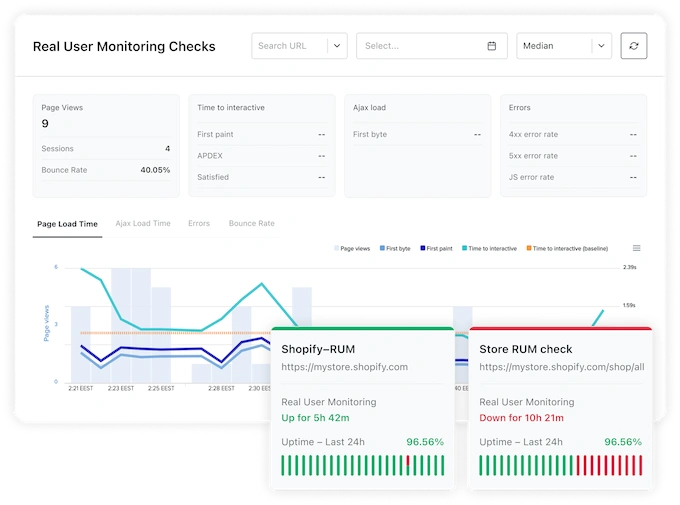
Get detailed insights into your website's performance by analyzing data from actual visitors. This includes metrics by device, operating system, browser, and geographic location.
Our monitoring solutions provide unmatched visibility and availability, empowering engineering, operations and SRE teams to monitor & respond to their most essential services.
Analyze visitor data across devices, browsers, OS and geographic locations.
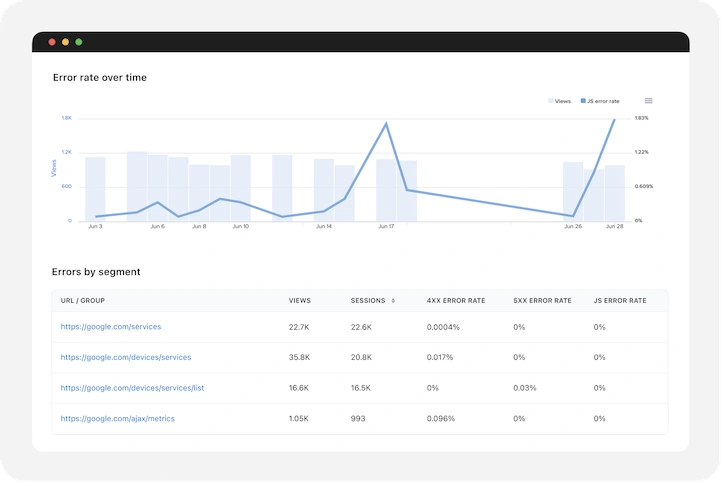
Detailed insights into HTTP status codes and JavaScript errors.
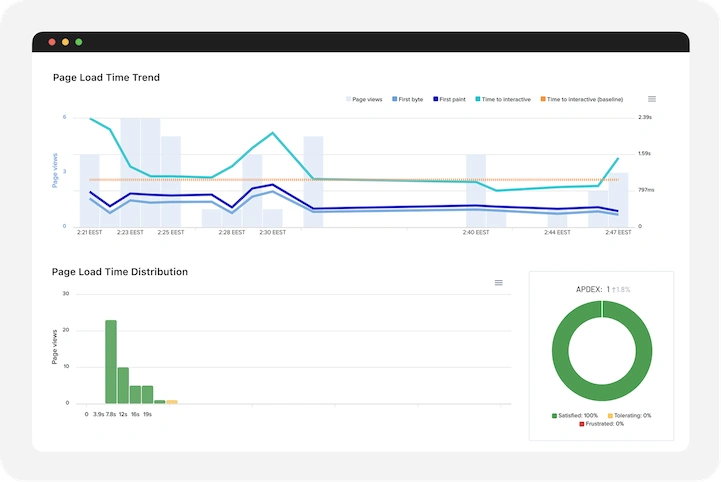
Compare current performance against historical data to diagnose issues.
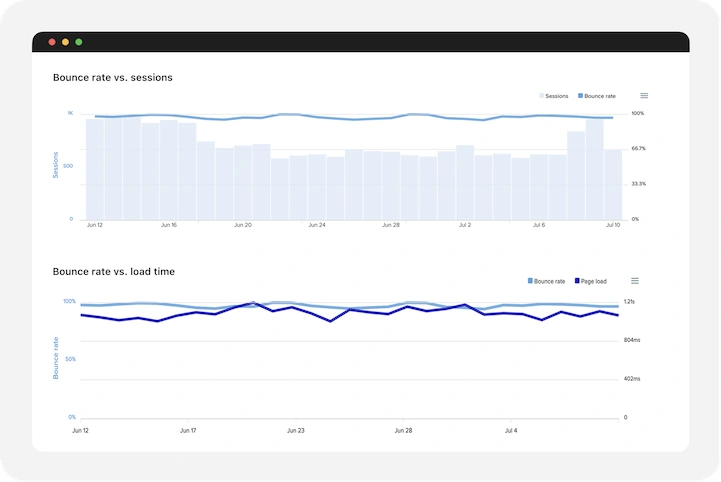
Correlate performance data with user satisfaction metrics such as Apdex.
Unified platform for uptime and RUM.

When your website's load time slows down, Uptime.com helps you act swiftly. Compare current page performance to established baselines to identify and address potential issues before they escalate into outages. This proactive approach ensures your website remains responsive and reliable.
24/7/365 real-time support
Resilient & secure platform